Recession Indicators: Check the 4 FRED Numbers Yourself With AI
Recession indicators are free to check. Pull four FRED numbers, and as of July 2026 none is triggered. Here is how to read them yourself with AI.
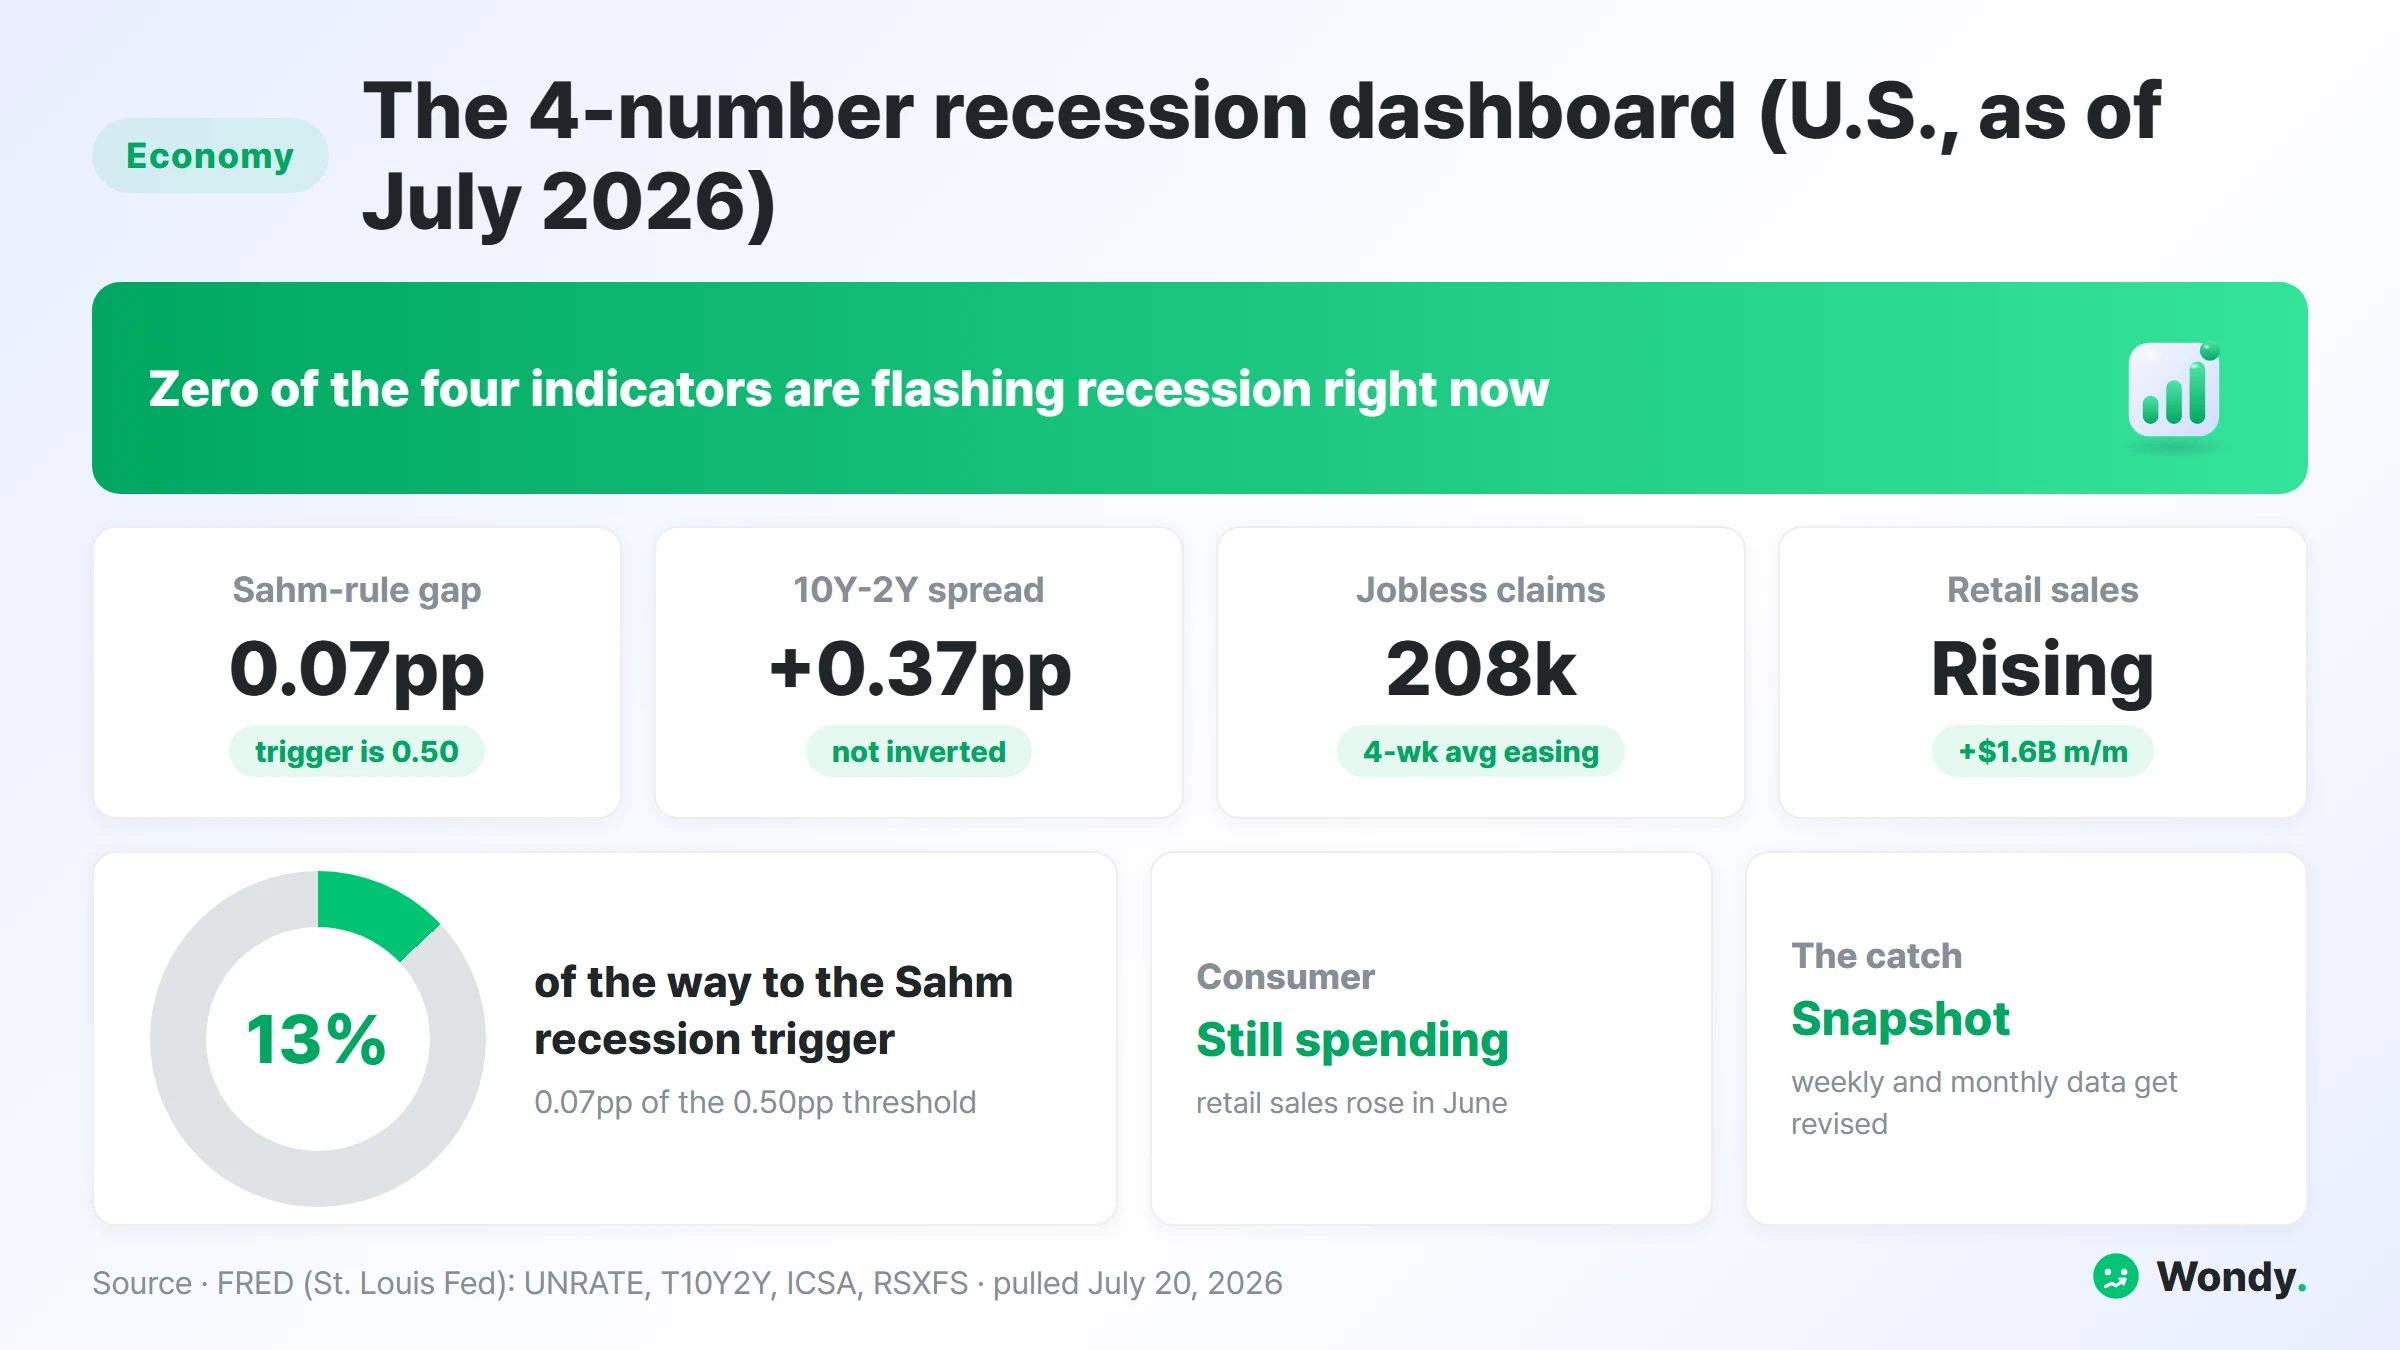
Four public numbers decide whether the U.S. economy is sliding into a recession, and as of July 2026 all four point the same calm way. The unemployment trend has moved 0.07 of a percentage point into a climb that needs 0.50 to signal trouble. The yield curve is positive. Jobless claims are drifting down week by week, and retail sales rose again last month.
None of that is a forecast, and none of it is hard to check. The data sits on one free government website, the Federal Reserve's FRED database, and an AI can read all four series in a single pass. Most people wait for a headline to interpret numbers that are already sitting there in the open.
Call it your recession dashboard: four gauges, all public, that you can read in ten minutes instead of handing the worry to a pundit. Here is what each gauge measures, and how to check it yourself.
The four numbers that actually move the recession call
Economists do not stare at one magic indicator, and neither should you. A recession shows up first in different places, the labor market, the bond market, and the consumer, so the useful move is to watch one number from each channel and see whether they agree. When they all lean the same way, the read is strong. When they split, the picture is genuinely uncertain, and that is worth knowing too.
1. The Sahm rule: is unemployment turning up fast?
The Sahm rule is the closest thing to a recession alarm, and it is quiet right now. In plain terms, it says a recession has probably already begun when the unemployment rate starts rising quickly off its recent floor. The exact form: take the three-month average of the unemployment rate, and compare it to the lowest three-month average from the previous 12 months. When that gap reaches 0.50 percentage point, the alarm sounds.
Economist Claudia Sahm designed it in 2019 to give policymakers a fast, real-time trigger, and it has flagged the start of every U.S. recession since 1970. With June 2026 data, the current three-month average sits near 4.27% and the prior-window low was 4.20%, so the gap is about 0.07 percentage point. That is roughly 13% of the way to the 0.50 trigger. The unemployment rate itself, 4.2% in June, is low by historical standards. FRED even publishes the calculation for you as the SAHMREALTIME series, so you can sanity-check your own math against it.
2. The yield curve: what the bond market is pricing
The yield curve is positive again, which is the bond market's way of saying it is not braced for an imminent downturn. The gauge here is the 10-year Treasury yield minus the 2-year, published on FRED as T10Y2Y. Normally longer-term bonds pay more than shorter ones. When that flips and the spread goes negative, the curve is "inverted," and inversions have come before most recessions.
As of July 17, 2026 the spread is about +0.37 percentage point, comfortably positive. The catch, which the next section returns to, is that this signal has a real false-alarm history, so it earns a spot on the dashboard rather than the last word.
3. Jobless claims: the weekly pulse
Jobless claims are the fastest signal on the board, and they are easing rather than spiking. Every Thursday the government reports how many people newly filed for unemployment benefits, published on FRED as ICSA. Because it lands weekly, it turns before the monthly jobs report does, which is why it is worth watching closely.
The latest reading is 208,000 for the week of July 11, and the four-week average is 214,250, down from 219,000 the prior four weeks. Layoffs sharp enough to mark a recession usually push claims well up toward and past 300,000; a drifting-down number near 210,000 is the opposite of that. It is a low, calm labor market, at least in the most recent weeks.
4. Retail sales: is the consumer still showing up?
Consumer spending is still rising, and the consumer is roughly 70% of the economy, so this matters more than its low profile suggests. The series is retail sales excluding food services, published on FRED as RSXFS. It rose to about 664.4 billion in May, a gain of roughly $1.6 billion month over month. A shopper who keeps spending is not the behavior of a household bracing for a downturn, and a monthly increase, small as it is, points up rather than down.
How to pull these four numbers from FRED
You do not need a subscription or any code, just the four series IDs and a browser. FRED is the St. Louis Fed's free public database, and the trick is to search by the ID rather than the plain-English name so you land on the exact series.
- 01Open fred.stlouisfed.org
Search the series ID, not the name. Start by typing UNRATE.
- 02Open all four series
UNRATE, T10Y2Y, ICSA, RSXFS. One tab each.
- 03Copy the recent values
Use the table view. Grab the last 12 to 15 months, with dates.
- 04Hand all four to AI
Ask it to compute the Sahm gap and check the other three trends.
Keep the observation date next to each value. These releases lag by different amounts, monthly for unemployment and retail sales, weekly for claims, daily for the spread, and FRED revises them later, so the date is part of the data. That habit is also what lets an AI do the arithmetic without guessing which month it is looking at.
The one prompt that reads all four for you
Once you have the numbers, an AI is genuinely useful for the part people get wrong: the Sahm-rule math. It is a fiddly rolling-average calculation, and a chatbot will run it cleanly as long as you supply the values and forbid it from inventing any. Paste this in, swap in your own FRED figures, and let it compute.
You are helping me check whether recent U.S. data
is signaling a recession. Use only the numbers I paste
below. Do not invent or estimate any values; if a value
is missing, say so and exclude it.

Data I pulled from FRED (with observation dates):
- UNRATE (unemployment rate), last 15 months: [paste]
- T10Y2Y (10yr minus 2yr spread), latest: [paste + date]
- ICSA (initial jobless claims), last 8 weeks: [paste]
- RSXFS (retail sales ex food), last 3 months: [paste]

Do the following:
1. Compute the Sahm-rule value: current 3-month average
   unemployment minus the lowest 3-month average of the
   prior 12 months. State whether it crosses 0.50.
2. Say whether the yield curve is inverted (negative).
3. Describe the 4-week trend in jobless claims.
4. Describe the latest month-over-month retail sales move.
5. Give a plain verdict, then list the limits: revisions,
   reporting lags, and any missing months.
With the July 2026 numbers, the reply came back close to this.
(excerpt)
| Indicator | Latest value | Observation date | Short status |
|---|---|---|---|
| Unemployment rate (UNRATE) | 4.2% | 2026-06-01 | Latest three-month average 4.2667%; Sahm-rule gap 0.0667 percentage point. |
| 10yr minus 2yr spread (T10Y2Y) | 0.37 pp | 2026-07-17 | Positive, so the curve is not inverted. |
| Initial jobless claims (ICSA) | 208,000 | 2026-07-11 | Four-week average 214,250, down from 219,000 the prior four weeks. |
| Retail sales ex food (RSXFS) | 666,056.0 | 2026-06-01 | Up from 664,439.0 in 2026-05-01, a rise of 1,617.0. |
Sahm rule arithmetic: current three-month UNRATE average = (4.3 + 4.3 + 4.2) / 3 = 4.2667%. The minimum prior three-month average in the trailing window was (4.2 + 4.3 + 4.1) / 3 = 4.2000%, ending 2025-06-01. Gap = 4.2667% − 4.2000% = 0.0667 percentage point. FRED reports . for UNRATE at 2025-10-01, so the averages ending 2025-10 through 2025-12 are unavailable and excluded from the minimum.
Overall verdict: taken together, these releases do not present a uniform near-term recession signal. The yield spread is positive, recent claims have eased on a four-week-average basis, retail sales excluding food services rose in the latest month, and the computed Sahm-rule gap is small. That is not certainty about the economy. Monthly and weekly releases can be revised, publication lags differ, the missing UNRATE observation reduces the prior-window comparison set, and any single indicator can be noisy. This is a limited snapshot, not investment or economic advice.
The value there is not that the AI declared the economy safe. It ran the rolling-average math without slipping, flagged the missing October 2025 unemployment reading on its own, and refused to overstate a snapshot. That is the right posture, and it is one you can hold too.
When four green lights still miss a recession
A calm dashboard is reassuring, not decisive, and the yield curve is the standing reminder of why. That indicator inverted from July 2022 to November 2023, the longest stretch in modern history, and the recession it is supposed to warn of never arrived in that window. GDP grew about 2.9% in 2023 instead. The 2019 inversion was another near-miss. A signal that "always works" until it doesn't is exactly the kind you should not read alone.
Two more limits are worth naming. Everything here gets revised: an unemployment rate or retail-sales figure can be restated a month or two later, which can nudge the Sahm gap after the fact. And there is a literal hole in the data, the October 2025 unemployment reading shows as missing in FRED, which shrinks the 12-month window the Sahm rule compares against. Neither breaks the read, but both are reasons to treat "0.07 of the way to a trigger" as this week's picture rather than a verdict on next quarter.
My own read: reassuring but not something I would bet on. If I had to watch one gauge first, it is jobless claims, because it updates weekly and tends to turn before the monthly data confirms anything. The dashboard's job is not to predict the future. It is to stop you from being the last person to notice when the numbers actually start moving, and to keep you from panicking when a single scary headline does not match the four numbers underneath it.
FAQ
How can I tell if a recession is coming?
You cannot know for sure, but you can read the same public data economists watch. Four free FRED series cover most of it: the unemployment trend (Sahm rule), the 10-year minus 2-year Treasury spread (yield curve), weekly jobless claims, and retail sales. When several turn down together, risk is rising; when they disagree, the picture is mixed. As of July 2026 none is signaling a recession. Treat it as a snapshot of released, revisable data, not a forecast.
What is the Sahm rule and has it been triggered?
It signals a likely recession when the three-month average unemployment rate rises 0.50 percentage point above its lowest three-month average from the prior 12 months. Claudia Sahm built it in 2019, and it has matched every U.S. recession start since 1970. With June 2026 data the gap is about 0.07 percentage point, well under 0.50, so it is not triggered. FRED publishes it as the SAHMREALTIME series.
Does an inverted yield curve always mean a recession?
No. The 10-year minus 2-year spread going negative has preceded most recessions, but the July 2022 to November 2023 inversion, the longest in modern history, was not followed by a recession in that window, and GDP grew about 2.9% in 2023. That is why a single signal can mislead and a four-indicator dashboard is safer. As of July 2026 the spread is positive at about +0.37, so the curve is not inverted.
Which FRED data should I check for recession signals?
Four series IDs: UNRATE (unemployment, feeds the Sahm rule), T10Y2Y (yield-curve spread), ICSA (weekly jobless claims), and RSXFS (retail sales excluding food). Search each ID on fred.stlouisfed.org, copy the last 12 to 15 months with their dates, and let an AI compute the Sahm gap and read the trends. Keep the dates, since these releases lag differently and get revised.
Disclaimer
This article is an educational explainer, not investment, financial, or economic advice, and it does not predict a recession or its timing. The figures are released government data as of July 20, 2026, and they get revised; publication lags differ by series. AI here does arithmetic on numbers you provide, not forecasting, and it can be wrong if your inputs are. Confirm every value against the original FRED series before you rely on it, and do not make financial decisions on a single snapshot.
For the pieces around this: to read the inflation number the same way, How to Read the CPI Report With AI. To see how much prices are actually rising for you, not the average household, Calculate Your Personal Inflation Rate With AI. And to turn a Fed headline into what it means for your wallet, Translate Fed News Into Your Wallet With AI.
Sources
- FRED, Unemployment Rate (UNRATE): https://fred.stlouisfed.org/series/UNRATE
- FRED, 10-Year minus 2-Year Treasury Spread (T10Y2Y): https://fred.stlouisfed.org/series/T10Y2Y
- FRED, Initial Jobless Claims (ICSA): https://fred.stlouisfed.org/series/ICSA
- FRED, Retail Sales Excluding Food Services (RSXFS): https://fred.stlouisfed.org/series/RSXFS
- FRED, Real-time Sahm Rule Recession Indicator (SAHMREALTIME): https://fred.stlouisfed.org/series/SAHMREALTIME
- Britannica Money, Sahm Rule Recession Indicator (0.50pp definition, Sahm 2019, every recession since 1970): https://www.britannica.com/money/sahm-rule-recession-indicator
- Congressional Research Service, The Sahm Rule Trigger: https://www.congress.gov/crs-product/IN12410
- Cleveland Fed, Yield Curve and Predicted GDP Growth (yield-curve record and 2022-23 inversion context): https://www.clevelandfed.org/indicators-and-data/yield-curve-and-predicted-gdp-growth
- 01
The Sahm rule triggers when the three-month average unemployment rate rises 0.50 percentage point above its lowest three-month average from the previous 12 months.
- 02
An inverted yield curve has always been followed by a recession, with no false signals.
- 03
As of July 2026, all four dashboard indicators were flashing recession at once.