Rent vs Buy in 2026: Run Your Own Numbers with Zillow Data and AI
Skip the hot takes. Zillow publishes its home value (ZHVI) and rent (ZORI) indexes as free CSV downloads, and a chatbot can turn them into your own price-to-rent ratio and monthly cost gap in five minutes. Nationally the math is close: a typical $370,320 home vs $2,000 average rent works out to a ratio around 15, right in the gray zone.
Is your rent quietly beating a mortgage this year, or losing to one? Not "rent vs buy" as a lifestyle debate, but the narrow, checkable question: in your ZIP code, this month, which one costs less? Every article on the topic ends with "it depends on your market," which is true and useless, unless you can actually check your market.
You can. The raw data is free, public, and small enough to drag into a chatbot. Zillow publishes the two series you need, and AI handles the spreadsheet work. Here is the whole pipeline, plus what the national numbers say right now.
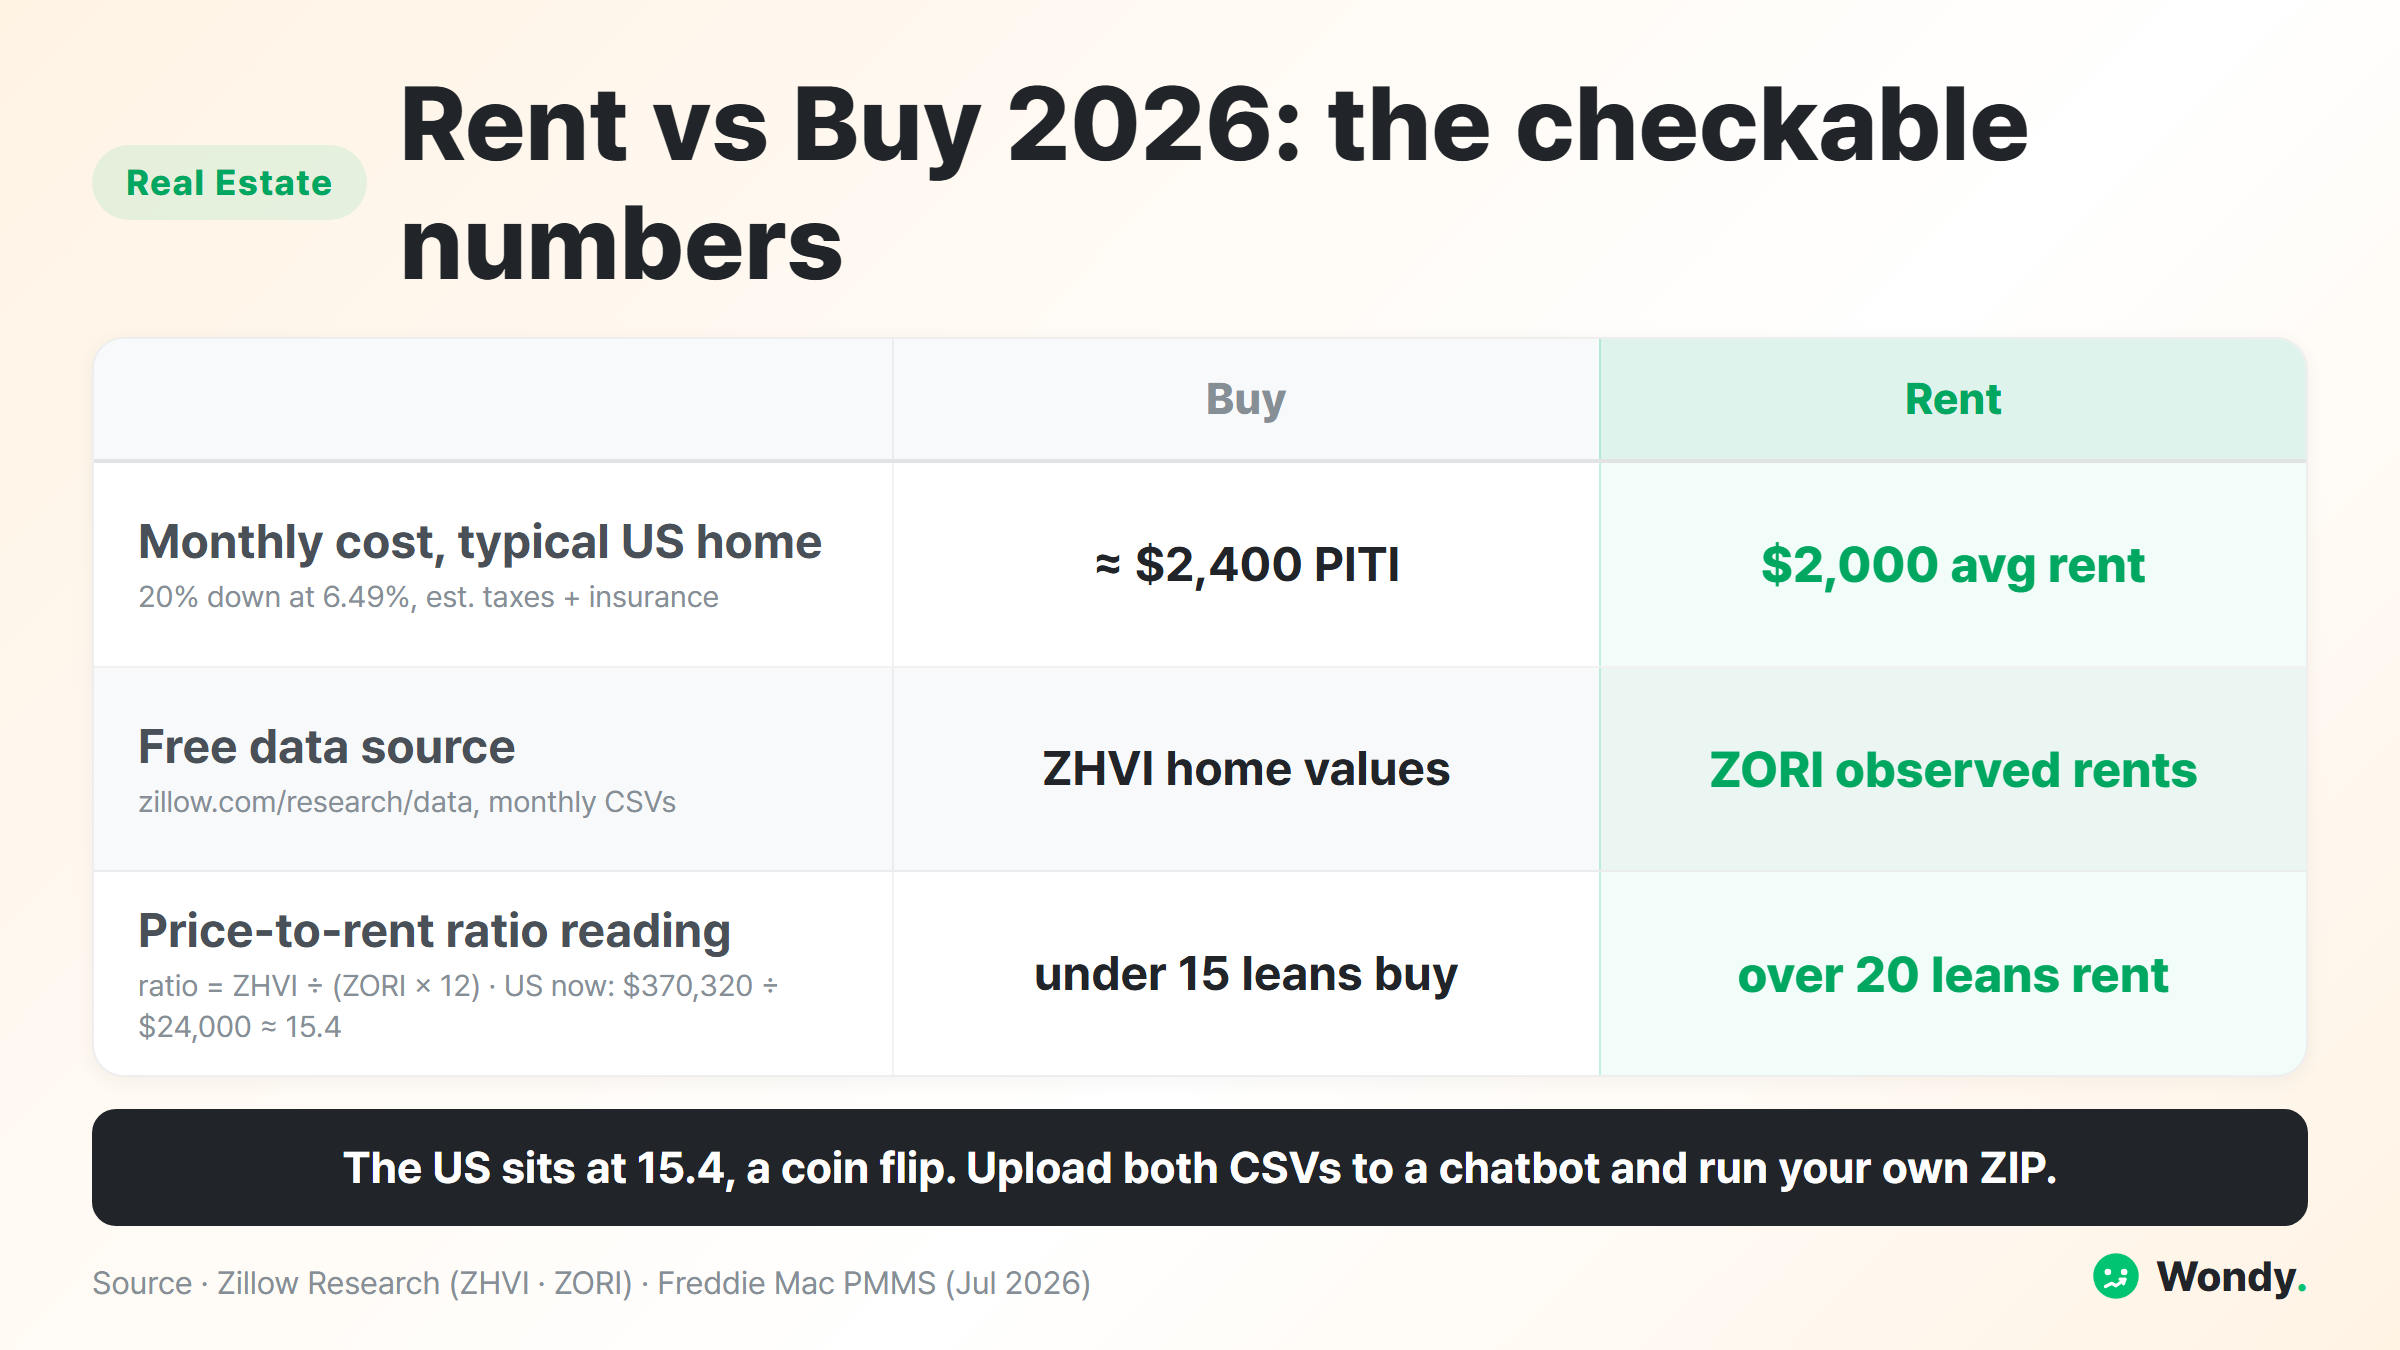
The two numbers that settle the argument
Strip away the emotion and rent-vs-buy comes down to two comparisons.
Price-to-rent ratio: the home price divided by a year of rent for a comparable place. It answers "how many years of rent does this house cost?" The common reading: under 15 leans toward buying, 15 to 20 is a judgment call, over 20 leans toward renting. Some analysts put the national midpoint near 20 across large metros, meaning plenty of big cities currently favor renters on cost.
Monthly cost gap: what a mortgage payment (principal, interest, taxes, insurance) costs versus renting the same home this month. This one answers the immediate question your budget actually feels.
Run the national figures and you see why 2026 is a genuine gray zone. Zillow's typical US home value is 2,000 a month, or $24,000 a year. Divide: 370,320 ÷ 24,000 ≈ 15.4. Right on the edge between "buy territory" and "judgment call."
The monthly gap tells a sharper story. Put 20% down on that typical home and you borrow about 1,870 a month, and adding typical taxes and insurance pushes estimated ownership cost to around 2,000 average rent, owning the typical US home costs about $400 more per month right now, before maintenance, and that estimate moves with your local tax rate.
National averages hide everything interesting, though. Metro-level ratios range from single digits in parts of the Midwest to over 25 on the coasts. Your ZIP code is the only row of the spreadsheet that matters, so let's go get it.
Where the free data lives
Zillow Research (zillow.com/research/data) hosts the downloads, no account required:
- 01Download ZHVI
Home Values CSV, pick metro or ZIP level
- 02Download ZORI
Rentals CSV, same geography level
- 03Note the vintage
Files update monthly around the 16th
- 04Grab the rate
Freddie Mac weekly 30-yr average
ZHVI is Zillow's "typical home value," roughly the middle of the market rather than the average skewed by mansions. ZORI is the observed market-rate rent, weighted to represent the whole rental stock, not just what happens to be listed today. Each CSV has one row per region and one column per month, which is exactly the shape chatbots handle well. If you want a second opinion later, the Census Bureau's American Community Survey and FRED both carry rent and price series to cross-check against.
I ran this myself: two CSVs into a chatbot
Upload both files to ChatGPT or Claude, then paste this and swap the brackets:
The two attached CSVs are Zillow's ZHVI (home values) and ZORI (rents).
Analyze [Austin, TX] (or ZIP [78704]).

1. Latest ZHVI value and the month it refers to
2. Latest ZORI value and its month
3. Price-to-rent ratio = ZHVI ÷ (ZORI × 12); classify: under 15 buy-leaning,
   15–20 gray zone, over 20 rent-leaning
4. Monthly ownership estimate: 20% down, 30-year loan at [6.49%],
   plus a property tax + insurance estimate you state explicitly
5. Compare that to ZORI rent: dollar gap per month
6. Same ratio 12 months ago from the same files: is it moving
   toward buyers or renters?

Show every formula. If my region is not in the file, say so;
do not substitute a different region silently.
Running my national-level example through the same structure, this is the shape of the answer you get back:
1–2. Latest values: typical home value 2,000/mo (both latest month in file).
3. Price-to-rent: 370,320 ÷ 24,000 = 15.4 → gray zone, neither clearly buy nor rent.
4. Ownership estimate: 20% down → 1,871/mo**; adding ~2,400/mo** (assumption stated, varies by county).
5. Monthly gap: owning ≈ **2,000 average rent, before maintenance.
6. Trend: home values roughly flat year over year (+0.7%), so the ratio has barely moved; no strong shift toward buyers or renters.
Caveat: national averages mask metro extremes; re-run this on your metro or ZIP rows.
That last caveat is the honest part, and it is why step 6 exists: a single month's ratio is a snapshot, but the direction of the ratio tells you whether waiting has been helping or hurting. My verification habit here is simple. I re-do the ratio division on a calculator, one line, and I check the AI actually used my region's row instead of quietly grabbing a neighbor. Those are the two places it slips.
What the ratio cannot tell you
Price-to-rent is a cost lens, not a life lens. It ignores how long you will stay, and transaction costs mean buying rarely wins if you might move within a few years. It ignores your rate, which may be better or worse than the survey average depending on credit. And it treats the down payment as free, when that cash could be earning interest elsewhere. Treat the ratio as the fast filter, the monthly gap as the budget reality, and the decision as yours. The point of pulling the data yourself is that nobody is summarizing it for you with an agenda.
FAQ
How do I calculate the price-to-rent ratio for my city?
Divide the typical home price by a full year of rent for a comparable home. Nationally: 24,000 ($2,000 × 12) ≈ 15.4. Common reading: under 15 leans buy, 15 to 20 is a judgment call, over 20 leans rent on pure cost.
Where can I download home price and rent data for free?
Zillow Research (zillow.com/research/data) publishes ZHVI (home values) and ZORI (rents) as free CSVs at metro, city, and ZIP level, updated monthly around the 16th. Census ACS and FRED are good cross-checks. No account or API key needed.
Is it cheaper to rent or buy in 2026?
On pure monthly cost, renting wins in many US markets right now: the typical home with 20% down at 6.49% runs an estimated 2,000 average rent. But it flips city by city, which is why you run your own ZIP.
Can ChatGPT analyze Zillow CSV files?
Yes. Upload the ZHVI and ZORI CSVs, name your metro or ZIP, and ask for the latest values, the ratio, and a mortgage-vs-rent comparison at the current rate. Verify one division by hand and confirm it used your region's row.
Disclaimer
This article shows how to analyze public housing data yourself. It is not financial or investment advice, and no outcome is guaranteed. Estimates use stated assumptions (20% down, average tax and insurance) that vary by location and person. Figures are as of July 13, 2026; download fresh data before deciding anything.
Sources
- Zillow Research, Housing Data downloads (ZHVI · ZORI): https://www.zillow.com/research/data/
- Zillow, United States Housing Market (typical home value $370,320): https://www.zillow.com/home-values/102001/united-states/
- Zillow Rental Manager, US Market Trends (average rent $2,000): https://www.zillow.com/rental-manager/market-trends/united-states/
- Freddie Mac, Primary Mortgage Market Survey (6.49%, week of July 9, 2026): https://www.freddiemac.com/pmms
- US Census Bureau, American Community Survey: https://www.census.gov/programs-surveys/acs